
RISK ALERT 247 IN PRACTICE
From one company
to the wider network.
A news report can raise a question. Connected company intelligence helps you work out where to look next. Follow an investigation from HU3 Corner Ltd to a wider graph of 363 distinct nodes—and on to data your team can use.
Graph screenshots updated: · Map view: 18 October 2026
THE PUBLIC REPORTING
A starting point
for enquiry.
On 5 November 2025, the BBC published an undercover investigation into alleged arrangements to facilitate illegal working and evade related penalties. Its reporting identified a man known as Shaxawan as Kardos Mateen in Companies House records. Mateen denied wrongdoing and the allegations put to him.
This case study demonstrates how Risk Alert 247 can explore recorded corporate connections from that starting point. It is a separate analysis, not a finding that every connected company or individual was involved in the alleged conduct.
Read the BBC investigation ↗01 / THE INVESTIGATION
Start with one company.
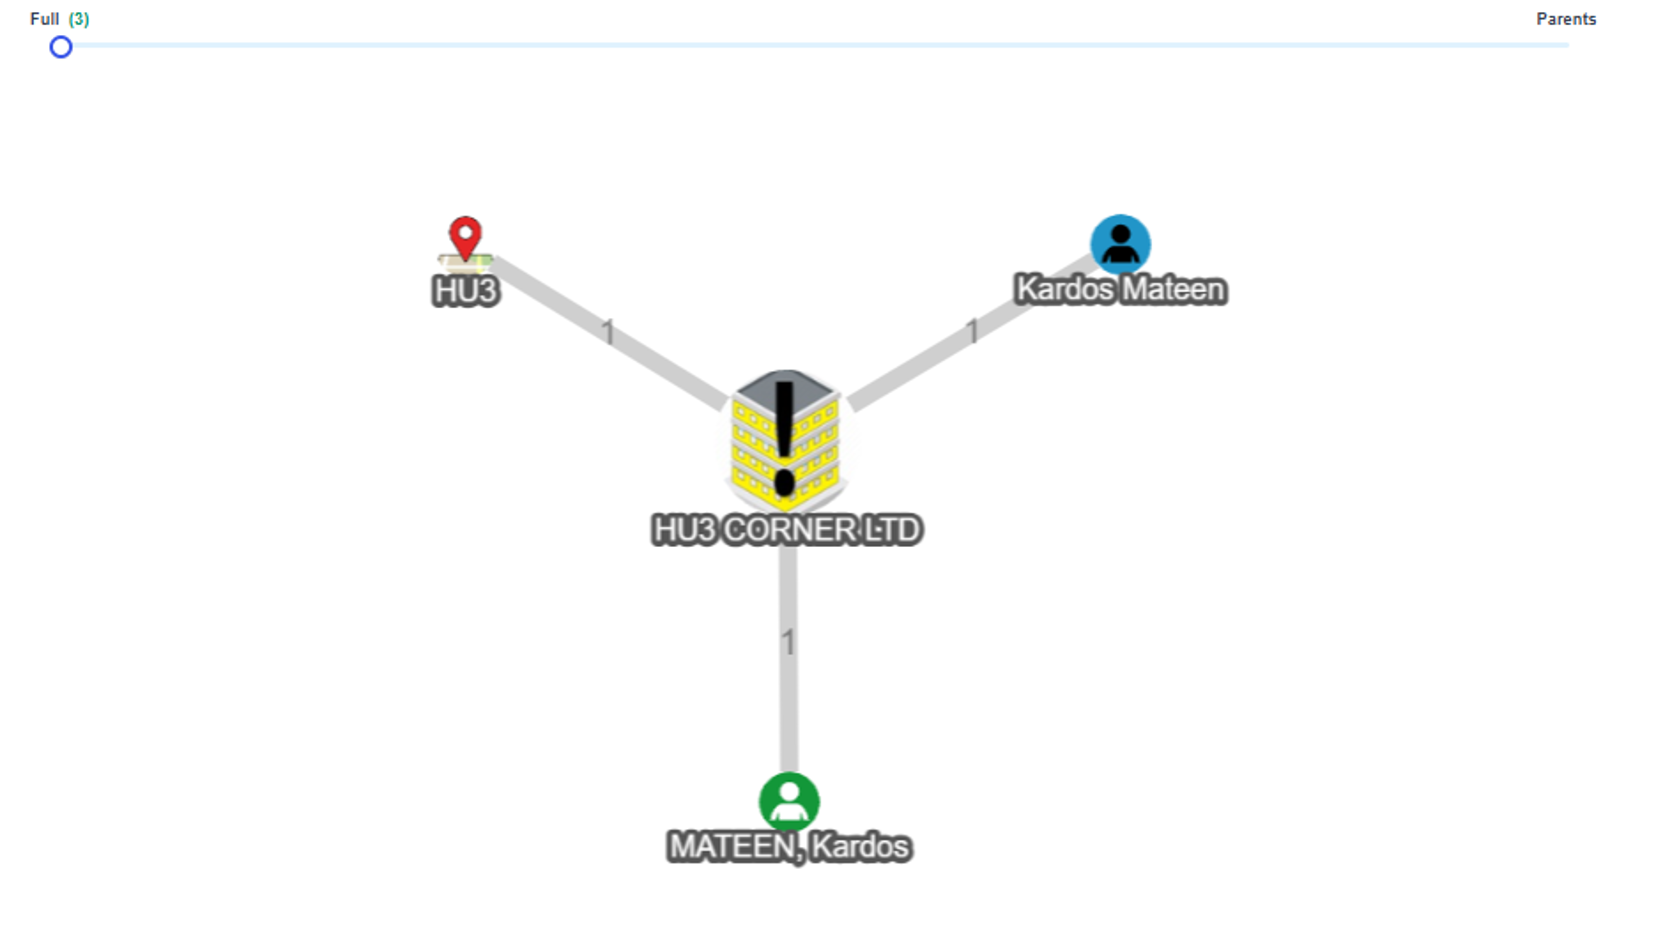
We begin with HU3 Corner Ltd, one of Kardos Mateen’s directorships, and place it in the Risk Alert 247 graph. The initial view brings the company, its director records and its recorded address into one connected picture.
An initial lead becomes a visible set of relationships.
02 / THE INVESTIGATION
Follow the directorships.
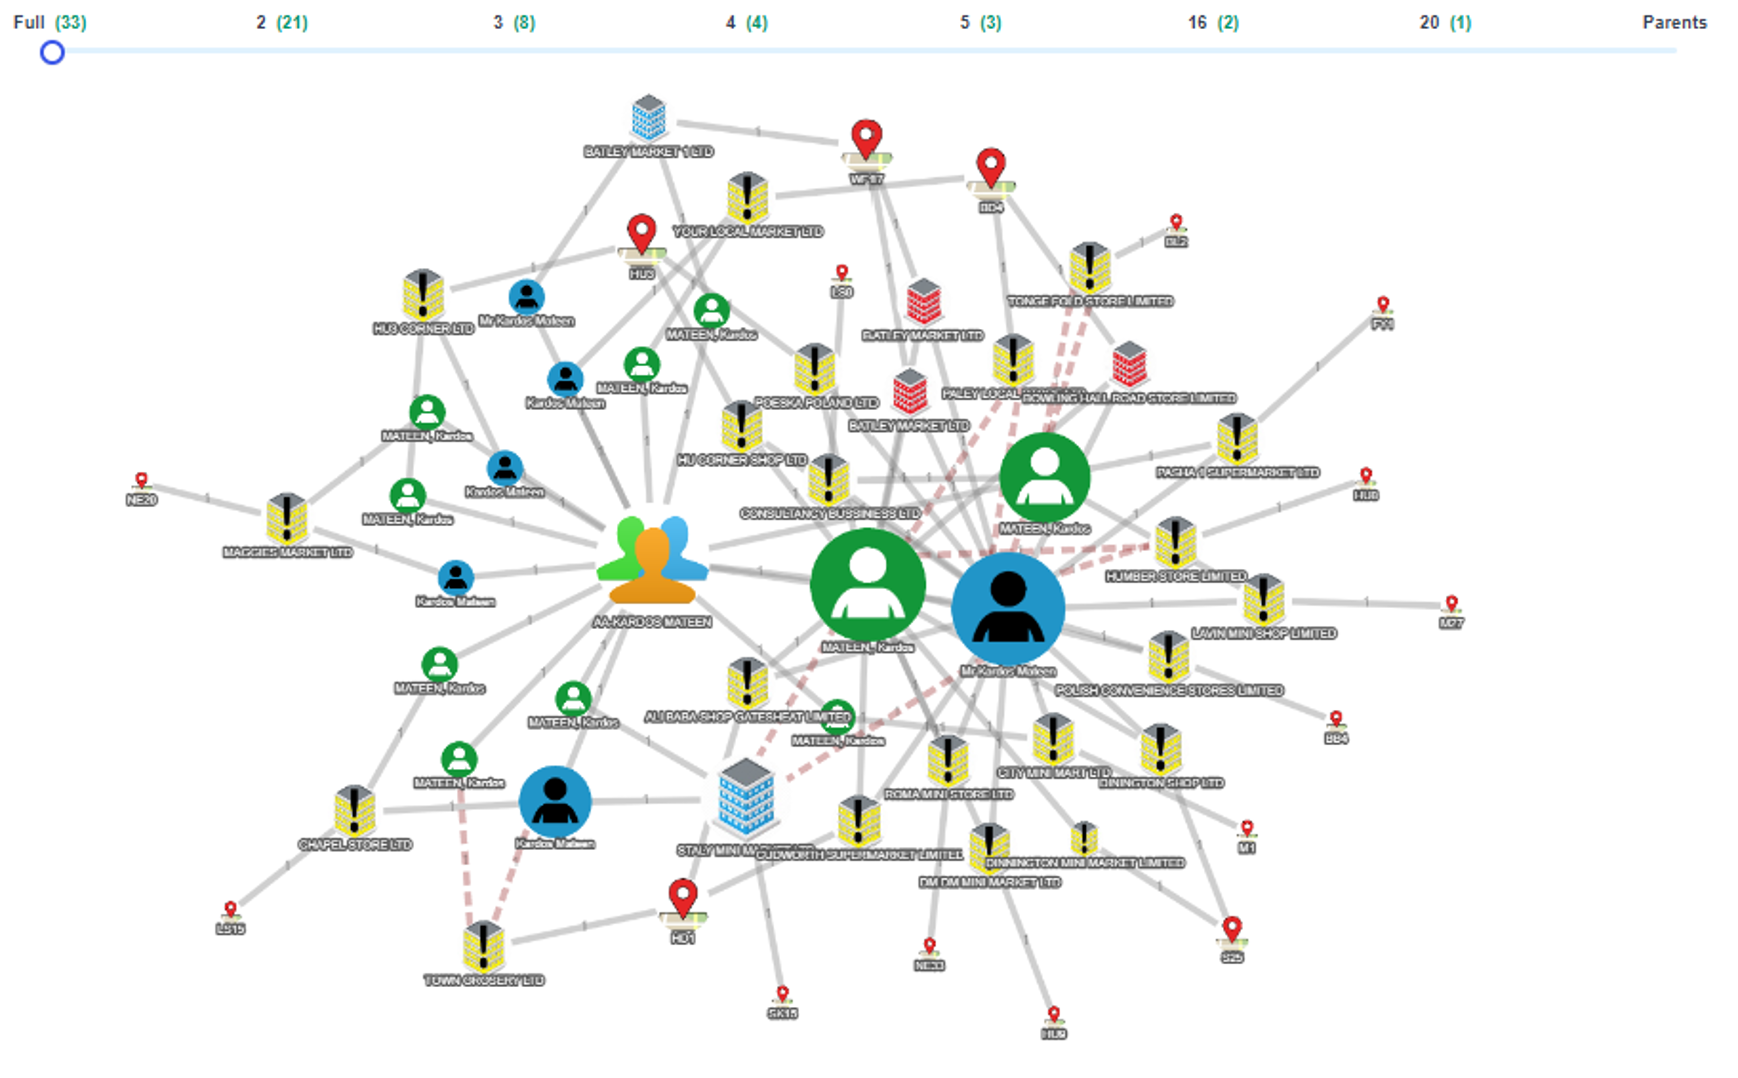
Expand the graph to include Mateen’s other directorships. Company records that would otherwise need to be examined separately can now be explored together, making the recorded connections easier to follow.
Move beyond a single company’s record.
03 / THE INVESTIGATION
Reveal the wider network.
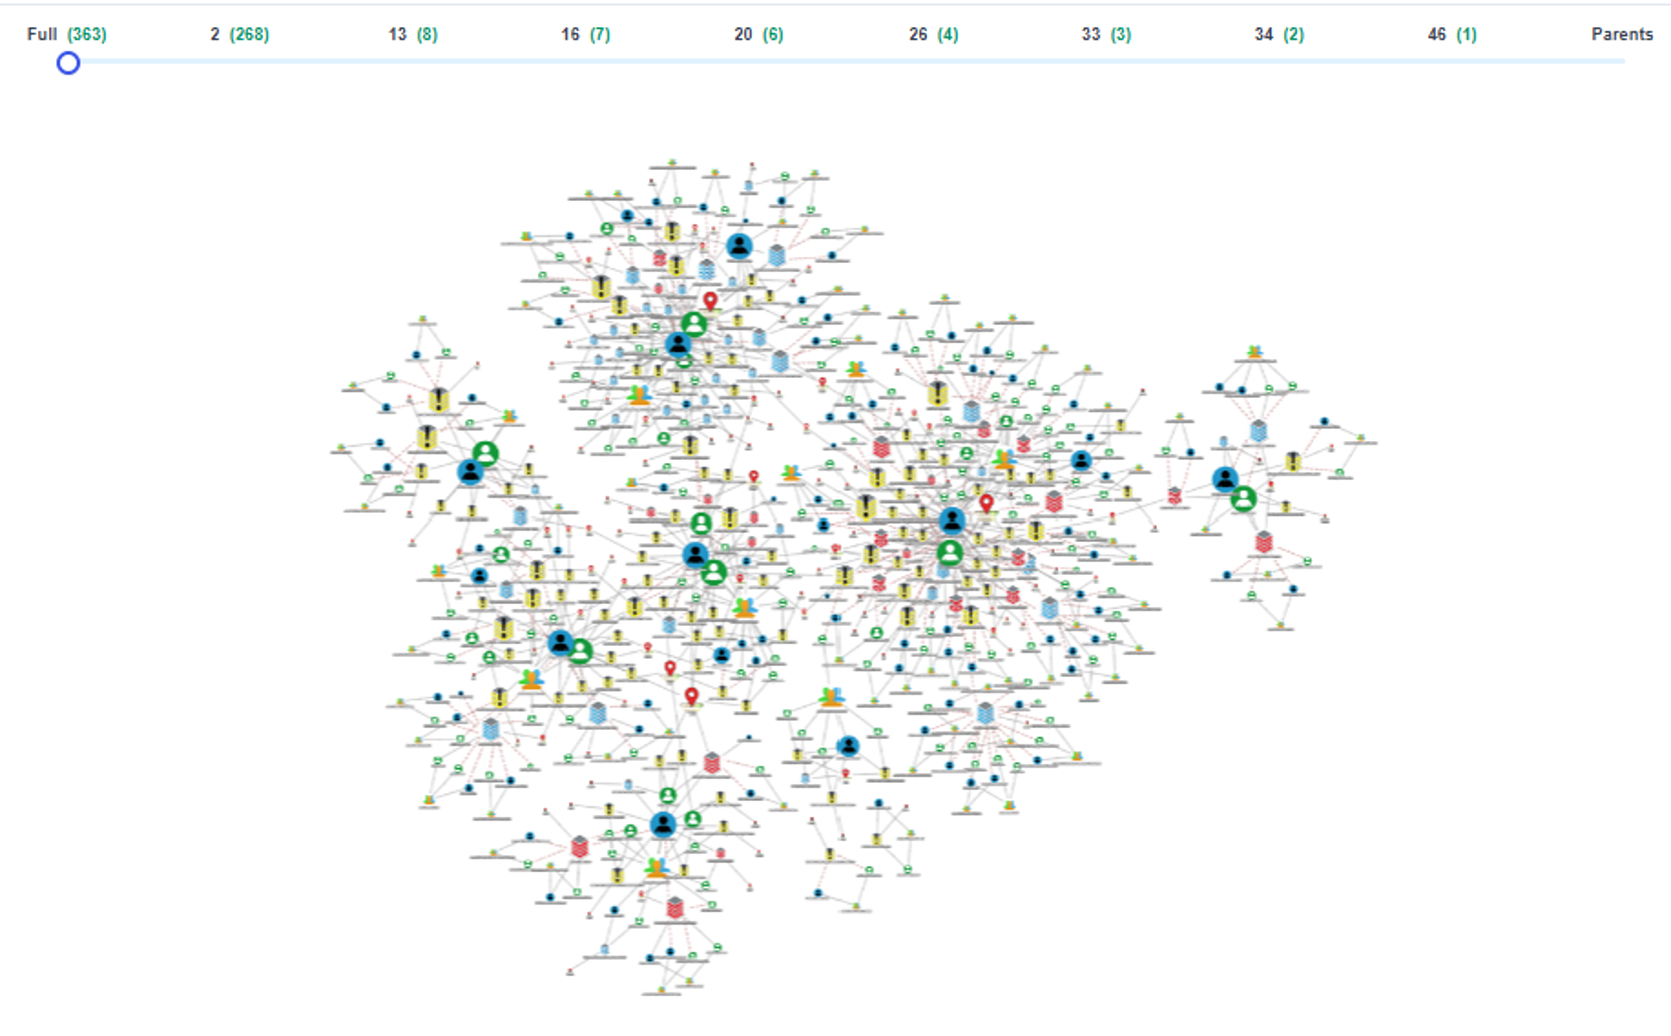
Apply Risk Alert 247’s bespoke algorithms to identify further connected companies through shared directors, common addresses and other recorded relationships. In this example, the expanded graph generates 363 distinct nodes for investigation. The nodes include company, person and address records. The new interface provides an expanded view of the connections available for investigation.
See the scale of the connected records—and where to investigate next.
04 / THE INVESTIGATION
Put the connections on the map.
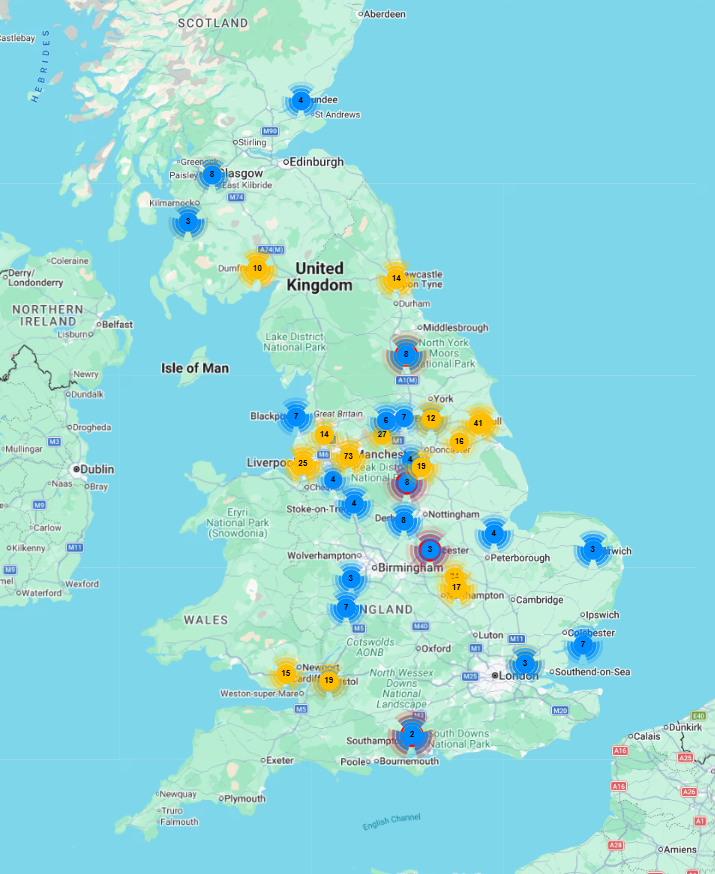
Plot the recorded addresses to see the geographical footprint and clusters within the network. The map below is retained from the earlier analysis on 18 October 2026; it illustrates the mapping stage and does not show the full updated 363-node graph. It includes company registered offices and directors’ correspondence addresses. In this example, Risk Alert 247 identifies almost all of these as the shops’ retail premises too; the address records alone do not establish a trading location.
Understand where the recorded connections are concentrated.
05 / TAKE THE INTELLIGENCE FORWARD
From a visual network
to structured data.
Export the companies’ details in CSV, Excel (.xlsx) or PDF format. Structured CSV and Excel files allow your team to work with the findings and ingest company information into firm-specific databases; PDF provides a document for review and sharing.
Carry the investigation forward without manually re-entering each company’s details.
THE PRACTICAL BENEFIT
Less piecing records together.
More time investigating.
Risk Alert 247 brings connected records, geographical context and exportable company information into one workflow—helping analysts scope an enquiry, prioritise follow-up questions and use the results in their own systems.
The graphs were updated on 27 October 2026. The map shows the earlier analysis of 18 October 2026. Neither is an exhaustive or permanent account of every connection. Corporate records can change. The wider network is a set of leads for investigation; individual relationships should be checked against the underlying records and corroborating evidence.
EXPLORE YOUR OWN QUESTIONS
See the connections
behind a company.
Ask for a demonstration of Risk Alert 247’s investigation and export workflow.